Case Study: From Flood Emergency to a Coordinated Response System in Hours
When historic flooding struck Avoyelles Parish, Subterra built and donated a response platform within hours to coordinate damage reports, housing, volunteers, and agricultural recovery.
On the morning of June 18, 2026, Avoyelles Parish was flooding faster than any normal process could keep up with. Roads were disappearing, families were being rescued by boat, and there was no dedicated digital system for residents to report what had happened to their homes.
By that afternoon, there was.
Subterra started with one immediate problem: give residents a simple way to document flood damage from their phones and give local officials a usable view of those reports. But the needs of the parish changed almost by the hour. Damage reporting became housing assistance. Housing assistance became shelter coordination. Volunteer groups needed a better way to find people asking for help. Farmers needed a way to document losses that a residential form could never capture.
The platform grew with the response because the people using it kept showing us what was needed next.
By the end, more than 1,200 submissions and 4,600 record-attached photographs had moved through the system. Those numbers show scale, but they are not the central story. The story is that a tool that did not exist when the storm began became part of the parish’s response while the emergency was still unfolding.
Subterra donated the platform, infrastructure, and development time. We live and work in this community, and we approached the project accordingly: build what was needed, make it available at no cost, and keep adapting it as the parish moved from rescue into recovery.
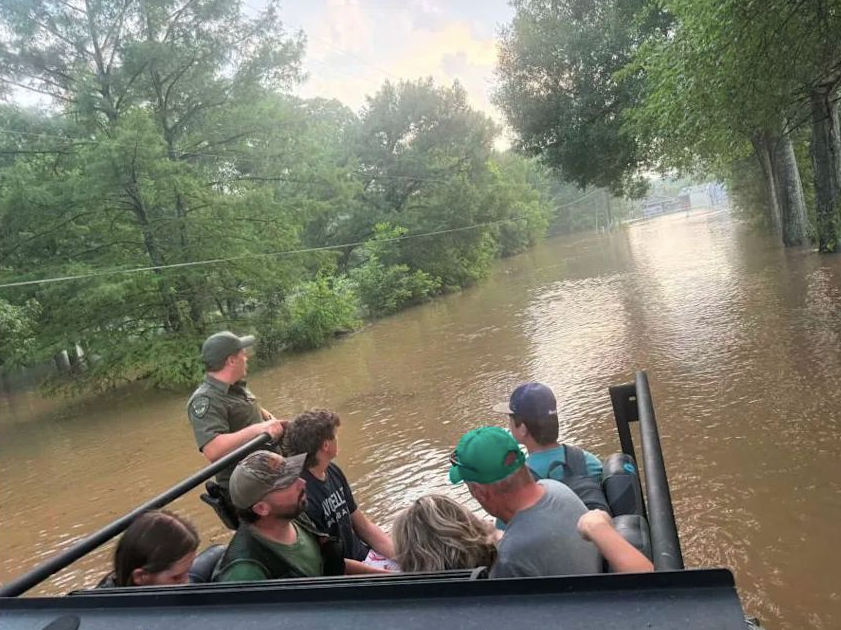
Louisiana Department of Wildlife and Fisheries personnel conduct floodwater rescues in Avoyelles Parish. LDWF later reported rescuing 86 people and 20 pets. Image: LDWF via WAFB.
Part One: The Response
Thursday morning: a parish under water
Rain from the remnants of Tropical Storm Arthur intensified rapidly over central Louisiana during the early hours of June 18.
At 8:59 a.m., the National Weather Service issued a Particularly Dangerous Situation Flash Flood Emergency. Radar estimates indicated that 8 to 12 inches of rain had already fallen, and serious flooding was underway.
Less than an hour later, the Weather Prediction Center warned of “life-threatening and locally catastrophic” flash flooding. Training thunderstorms were producing rainfall rates of 3 to 5 inches per hour, with another 5 to 10 inches possible in the hardest-hit areas.
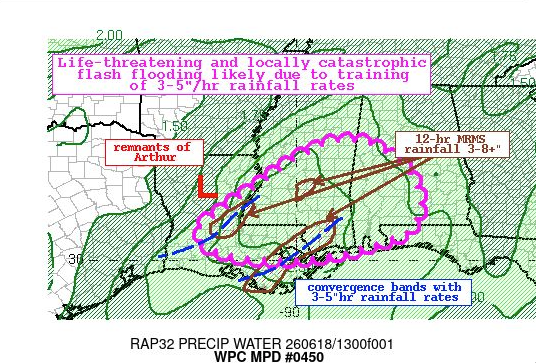
NOAA Weather Prediction Center Mesoscale Precipitation Discussion #0450, issued at 9:50 a.m. CDT on June 18, 2026. View the original warning.
By midday, large-scale rescue operations were underway. Roads had disappeared beneath the water. Families were leaving homes by boat, and responders were working across several communities at once.
Later measurements would put numbers to what residents were already seeing: a 20-to-38-inch rainfall swath across parts of the parish, including a 37.58-inch storm total near Cottonport. More than 300 homes flooded and approximately 500 people were evacuated. Remarkably, the official National Weather Service impact summary reported no deaths or injuries.
In the moment, however, the problem was less abstract. People needed help, and local officials needed information they could act on.
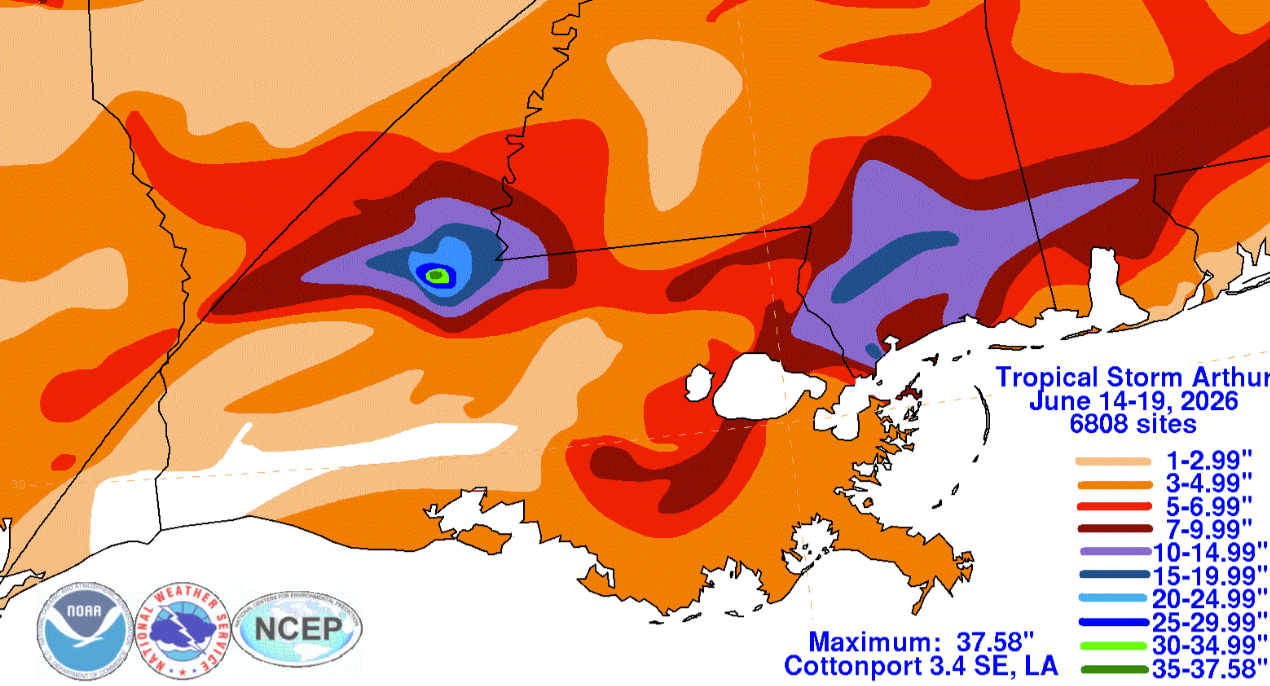
NOAA’s storm-total rainfall analysis shows the extraordinary concentration of rain over Avoyelles Parish, including 37.58 inches near Cottonport. View NOAA’s rainfall summary.
Thursday afternoon: building the first response tool
When the storm began, there was no dedicated Subterra platform waiting to be activated.
There was no public damage form, photograph repository, parish review dashboard, housing application system, volunteer portal, or agricultural assessment workflow. Those capabilities had to be built while the emergency was already underway.
Subterra began development Thursday afternoon with a deliberately narrow goal: create the smallest complete system that could help immediately.
An hour later, the first production-ready version existed. It gave residents a mobile-friendly form, a place to attach photographs, and a structured record that local reviewers could actually use.
The public reporting site followed minutes later. At 4:06 p.m., the first resident report entered the system.
That submission changed the project. Until then, Subterra was building software. From that moment forward, someone in the parish was relying on it to document what had happened to their home.
More reports arrived while the platform was still changing. Residents pointed out confusing questions. Reviewers asked for better ways to organize cases. Local officials identified information they needed but did not yet have. Subterra worked into Thursday night turning that feedback into production updates.
By the end of the afternoon, 11 updates had already been released—but the more important point was that the platform was now evolving in public, alongside the response itself.
%%{init: {"flowchart": {"nodeSpacing": 32, "rankSpacing": 42, "curve": "basis"}, "themeVariables": {"fontSize": "20px"}}}%%
flowchart TB
    A["Thursday morning<br/>Historic flooding begins<br/>No dedicated platform exists"] --> B["Thursday afternoon<br/>Subterra begins building"]
    B --> C["First production-ready system<br/>in approximately 14 minutes"]
    C --> D["4:06 p.m.<br/>First resident report"]
    D --> E["Thursday evening<br/>11 production updates"]
    E --> F["Friday and weekend<br/>Review, mapping and new workflows"]
    F --> G["Following week<br/>Housing, shelter, volunteers and agriculture"]
    G --> H["Ongoing response<br/>Public and agency feedback"]

    classDef danger fill:#b91c1c,stroke:#fca5a5,color:#ffffff,stroke-width:2px;
    classDef build fill:#1d4ed8,stroke:#93c5fd,color:#ffffff,stroke-width:2px;
    classDef live fill:#047857,stroke:#6ee7b7,color:#ffffff,stroke-width:2px;
    classDef improve fill:#7c3aed,stroke:#c4b5fd,color:#ffffff,stroke-width:2px;

    class A danger;
    class B,C build;
    class D live;
    class E,F,G,H improve;

    linkStyle default stroke:#cbd5e1,stroke-width:2px;
Thursday night and Friday: turning reports into usable information
The reports came quickly. Within hours, the system was no longer dealing with a handful of individual cases but with hundreds of homes, photographs, addresses, and descriptions arriving from across the parish.
The challenge had shifted. Collecting information was no longer enough; the Police Jury and response teams needed to understand it.
They needed to know which submissions represented separate properties, where the properties were located, how much water residents were reporting, which communities were experiencing the most concentrated damage, and where follow-up might be required.
Subterra continued working Thursday night and throughout Friday to:
- Improve form validation
- Normalize addresses
- Identify likely duplicate reports
- Geocode affected properties
- Organize uploaded photographs
- Add review and status tools
- Improve exports for operational use
- Make the system easier to use from a phone
Feedback came from several directions.
Residents told us when a question was unclear or difficult to complete. Reviewers identified information they needed to make decisions. The Police Jury helped define local priorities. Emergency-response contacts explained how records needed to be grouped and presented.
The incoming data also provided feedback of its own. Patterns in incomplete fields, duplicate addresses, failed uploads, and review activity showed Subterra where the platform needed to improve.
The system evolved because those feedback channels remained open. Subterra’s role was not merely to collect reports. It was to turn what the community and response teams were telling us into better tools while the response continued.
The weekend: following the disaster’s changing needs
The work did not stop after the first surge of reports.
Reports continued through the weekend, even as the character of the emergency began to change.
The parish was moving from immediate rescue toward recovery, and residents were starting to face a different set of problems.
Residents still needed to document damage, but many were also confronting a more immediate question: where would they live?
Some homes were uninhabitable. Households had different requirements based on family size, children, seniors, pets, medical needs, accessibility concerns, and whether temporary accommodations could be placed on their property.
Subterra worked through the weekend to expand the platform beyond damage reporting.
A housing-needs workflow went into production Sunday. Instead of asking only what had happened to a property, it asked what a household needed next: how many people were displaced, whether children or seniors were involved, whether pets had to be accommodated, and whether there were medical or accessibility concerns.
Nearly every respondent indicated a need for housing. The workflow helped turn those individual situations into a structured picture the Avoyelles Parish Police Jury could use while administering state-supplied temporary housing.
Monday: organizing shelter and temporary housing
On Monday, Subterra launched a more detailed shelter and temporary-housing application workflow.
The first application arrived less than an hour after launch, and the workflow quickly became more than an intake form. It became the working record for households trying to move from displacement toward temporary stability.
Across the response, 239 distinct households were represented, covering 704 people. Applications captured practical details that mattered to real placement decisions—pets, medical needs, accessibility concerns, supporting photographs, and changes in status over time.
Police Jury reviewers used the system to work through every canonical household and record hundreds of review and status actions. The platform ultimately tracked placed statuses for 130 households representing 389 people, including families assigned camper accommodations.
Subterra did not make placement decisions. Our role was to give the Police Jury a usable, continuously updated system for receiving applications, understanding household needs, recording decisions, and seeing what still required attention.
%%{init: {"flowchart": {"nodeSpacing": 32, "rankSpacing": 42, "curve": "basis"}, "themeVariables": {"fontSize": "20px"}}}%%
flowchart TB
    A["266 applications"] --> B["239 canonical households"]
    B --> C["704 people represented"]
    B --> D["117 households with pets"]
    B --> E["74 with medical or accessibility needs"]
    F["555 review actions"] --> G["Every canonical household reviewed"]
    G --> H["130 households with placed statuses"]
    H --> I["389 people represented"]

    classDef intake fill:#1d4ed8,stroke:#93c5fd,color:#ffffff,stroke-width:2px;
    classDef household fill:#7c3aed,stroke:#c4b5fd,color:#ffffff,stroke-width:2px;
    classDef people fill:#0369a1,stroke:#7dd3fc,color:#ffffff,stroke-width:2px;
    classDef needs fill:#b45309,stroke:#fcd34d,color:#ffffff,stroke-width:2px;
    classDef review fill:#047857,stroke:#6ee7b7,color:#ffffff,stroke-width:2px;

    class A intake;
    class B household;
    class C people;
    class D,E needs;
    class F,G,H,I review;

    linkStyle default stroke:#cbd5e1,stroke-width:2px;
Tuesday: connecting volunteers with people who needed help
Housing was only one part of recovery.
Residents needed help removing debris, moving damaged belongings, clearing yards and access points, locating supplies, and completing physical work they could not safely handle themselves.
At the same time, volunteer organizations were ready to help but needed a more reliable way to find and understand actual requests. A general call for volunteers could bring people forward, but it did not tell an organization where to send them or what equipment they might need.
On Tuesday, Subterra launched a volunteer coordination portal.
The portal helped connect both sides of the response. Residents could describe where assistance was needed, while volunteer organizations could work from structured requests instead of relying entirely on phone calls, social media posts, and word of mouth.
Additional community boards helped organize requests for help, offers of supplies, and available service locations. These tools gave volunteer groups a shared operational picture while allowing residents to communicate their needs directly.
This was another example of the system following the response rather than remaining fixed. It began as a damage-reporting form, then became part of the connection between people asking for help and the organizations prepared to provide it.
Wednesday: documenting the agricultural disaster
Avoyelles Parish is an agricultural community. The flooding did not stop at residential property lines.
Fields, livestock operations, equipment, farm buildings, roads, and drainage infrastructure were also affected. Those losses were difficult to represent through a residential damage form, yet they were essential to understanding the disaster’s full impact.
On Wednesday morning, Subterra launched a dedicated agricultural survey. The first response arrived approximately half an hour later.
Farmers and agricultural producers used the survey to document planted acreage, flooded acreage, crop losses, damaged equipment, infrastructure damage, livestock impacts, and supporting photographs.
The agricultural workflow captured 80 producer-submitted surveys and 309 photographs. Together, those responses represented more than 116,000 planted acres, nearly 57,000 reported flooded acres, and $34.58 million in self-reported estimated losses.
The value of the survey was not simply the size of the total. Before the workflow existed, much of that information lived on individual farms, in phone calls, photographs, and conversations. The survey turned those scattered accounts into a structured picture of crop, equipment, infrastructure, and livestock losses while recovery decisions were still being made.
These were respondent-certified estimates rather than audited determinations, but they provided an early view of the agricultural disaster that would have been difficult to assemble quickly by conventional means.
The broader statewide assessment later estimated $112.2 million in agricultural losses across seven parishes, with Avoyelles accounting for more than 60 percent of the total, according to the LSU AgCenter.
Continuing to listen
The system continued evolving after the first week.
Requests came from residents, public users, volunteer groups, reviewers, the Police Jury, the 911 center, and GOHSEP—the state emergency-management agency.
In one documented example, a status requirement requested by Joey Frank at the 911 center and communicated through GOHSEP was translated into a production update in less than a hour.
That speed was possible because the feedback process was direct:
%%{init: {"flowchart": {"nodeSpacing": 32, "rankSpacing": 42, "curve": "basis"}, "themeVariables": {"fontSize": "20px"}}}%%
flowchart TB
    A["Residents submit reports<br/>and public feedback"] --> B["Subterra validates<br/>and organizes the data"]
    B --> C["Police Jury and response<br/>teams review cases"]
    C --> D["Operational needs become<br/>direct feedback"]
    D --> E["Subterra releases<br/>an improvement"]
    E --> F["Updated tools return to<br/>the public and responders"]
    F --> A

    classDef public fill:#0369a1,stroke:#7dd3fc,color:#ffffff,stroke-width:2px;
    classDef platform fill:#1d4ed8,stroke:#93c5fd,color:#ffffff,stroke-width:2px;
    classDef partner fill:#7c3aed,stroke:#c4b5fd,color:#ffffff,stroke-width:2px;
    classDef feedback fill:#b45309,stroke:#fcd34d,color:#ffffff,stroke-width:2px;
    classDef release fill:#047857,stroke:#6ee7b7,color:#ffffff,stroke-width:2px;

    class A public;
    class B platform;
    class C partner;
    class D feedback;
    class E,F release;

    linkStyle default stroke:#cbd5e1,stroke-width:2px;
The platform was never treated as a finished product. It was treated as a living response system that had to keep changing as Avoyelles Parish moved from rescue to documentation, temporary housing, volunteer coordination, agricultural assessment, and longer-term recovery.
Part Two: How Subterra Built and Evolved the System So Quickly
Starting with the smallest complete response loop
Subterra did not attempt to build every possible emergency-management feature before launching.
The first objective was to establish one dependable response loop:
%%{init: {"flowchart": {"nodeSpacing": 32, "rankSpacing": 42, "curve": "basis"}, "themeVariables": {"fontSize": "20px"}}}%%
flowchart TB
    A["Resident submits<br/>essential information"] --> B["Structured record<br/>is stored"]
    B --> C["Photographs are<br/>attached separately"]
    C --> D["Staff reviews and<br/>updates the case"]
    D --> E["Reports are mapped<br/>and exported"]
    E --> F["Response teams act<br/>on the information"]

    classDef resident fill:#0369a1,stroke:#7dd3fc,color:#ffffff,stroke-width:2px;
    classDef data fill:#1d4ed8,stroke:#93c5fd,color:#ffffff,stroke-width:2px;
    classDef review fill:#7c3aed,stroke:#c4b5fd,color:#ffffff,stroke-width:2px;
    classDef action fill:#047857,stroke:#6ee7b7,color:#ffffff,stroke-width:2px;

    class A resident;
    class B,C data;
    class D,E review;
    class F action;

    linkStyle default stroke:#cbd5e1,stroke-width:2px;
Once that loop worked, Subterra extended it rather than starting over:
- Damage reporting established public intake, photographs, mapping, and review.
- Housing added household composition and immediate accommodation needs.
- Shelter applications added pets, accessibility requirements, verification, placement statuses, and review history.
- Volunteer tools connected organizations with residents requesting help.
- Agricultural surveys added acreage and categorized loss estimates.
The underlying system remained familiar even as the mission expanded.
Designing for weak cellular service
A disaster-reporting system is only useful if residents can reach it under disaster conditions.
Many submissions came from phones in areas with weak or inconsistent cellular service. Large photographs presented the greatest challenge. Modern phone images can be several megabytes each, and residents could attach as many as ten.
Subterra designed the upload process around that limitation.
Before transmission, larger photographs were processed directly on the resident’s phone. Images greater than approximately 600 kilobytes were resized to a maximum dimension of 2,048 pixels and compressed as JPEG files at 70 percent quality.
This preserved enough detail for damage review while reducing the amount of data that had to cross a weak cellular connection.
If processing failed or the phone did not support it, the system safely fell back to the original photograph. It also retained the original whenever compression failed to produce a smaller file.
Each photograph was uploaded independently and retried once if the first attempt failed. Uploads traveled directly from the resident’s phone to cloud storage rather than passing through the application server, avoiding a serverless request-size limitation and removing an unnecessary transfer step.
Most importantly, a failed photograph did not cause the entire report to fail.
The platform prioritized the structured report: the resident’s address, contact information, property type, water depth, housing circumstances, or agricultural losses. If cellular service dropped during an image upload, the system could still save the essential information and notify the resident that one or more photographs had not arrived.
%%{init: {"flowchart": {"nodeSpacing": 32, "rankSpacing": 42, "curve": "basis"}, "themeVariables": {"fontSize": "20px"}}}%%
flowchart TB
    A["Photo selected<br/>on resident's phone"] --> B["Larger than<br/>600 KB"]
    B --> C["Resize to maximum<br/>2,048-pixel edge"]
    C --> D["Compress to JPEG<br/>at 70 percent quality"]
    D --> E["Upload directly<br/>to cloud storage"]
    E --> F["Retry once<br/>if interrupted"]
    F --> G["Attach successful photo<br/>to the report"]

    E --> H["Upload still fails"]
    H --> I["Save the structured<br/>report without blocking"]

    classDef phone fill:#0369a1,stroke:#7dd3fc,color:#ffffff,stroke-width:2px;
    classDef process fill:#7c3aed,stroke:#c4b5fd,color:#ffffff,stroke-width:2px;
    classDef upload fill:#1d4ed8,stroke:#93c5fd,color:#ffffff,stroke-width:2px;
    classDef success fill:#047857,stroke:#6ee7b7,color:#ffffff,stroke-width:2px;
    classDef fallback fill:#b45309,stroke:#fcd34d,color:#ffffff,stroke-width:2px;

    class A phone;
    class B,C,D process;
    class E,F upload;
    class G success;
    class H,I fallback;

    linkStyle default stroke:#cbd5e1,stroke-width:2px;
This was not a completely offline application; residents still needed a connection to submit. Instead, the system was engineered to make better use of limited connectivity and avoid losing an entire report because one large photograph could not finish uploading.
Preserving the visual record
Photographs were more than attachments. They provided visual evidence of water levels, structural damage, flooded fields, damaged equipment, household conditions, and individual losses.
By the end of the response, 4,613 photographs remained attached directly to operational records across damage, housing, and agricultural workflows. The underlying storage held roughly nine gigabytes of community-submitted material.
That visual record mattered because it placed the structured data in context: an address could be reviewed beside a water line on a wall; an agricultural estimate beside photographs of a flooded field or damaged equipment.
%%{init: {"flowchart": {"nodeSpacing": 32, "rankSpacing": 42, "curve": "basis"}, "themeVariables": {"fontSize": "20px"}}}%%
flowchart TB
    A["4,934 uploaded objects<br/>Approximately 8.56 GiB stored"]
    A --> B["4,613 photographs attached<br/>to operational records"]
    B --> C["3,792<br/>Damage"]
    B --> D["512<br/>Shelter and housing"]
    B --> E["309<br/>Agriculture"]
    A --> F["321 other or unattached<br/>upload objects"]

    classDef total fill:#7c3aed,stroke:#c4b5fd,color:#ffffff,stroke-width:2px;
    classDef attached fill:#1d4ed8,stroke:#93c5fd,color:#ffffff,stroke-width:2px;
    classDef damage fill:#b91c1c,stroke:#fca5a5,color:#ffffff,stroke-width:2px;
    classDef housing fill:#0369a1,stroke:#7dd3fc,color:#ffffff,stroke-width:2px;
    classDef agriculture fill:#047857,stroke:#6ee7b7,color:#ffffff,stroke-width:2px;
    classDef other fill:#475569,stroke:#cbd5e1,color:#ffffff,stroke-width:2px;

    class A total;
    class B attached;
    class C damage;
    class D housing;
    class E agriculture;
    class F other;

    linkStyle default stroke:#cbd5e1,stroke-width:2px;
Separating photographs from the primary database was important. The database could remain focused on searchable information such as addresses, household needs, water depths, review statuses, and agricultural losses, while dedicated object storage handled the much larger image files.
Preserving raw reports while creating an operational picture
Public disaster data is naturally messy.
Residents may submit more than once, enter an address differently, upload overlapping photographs, or return later with better information. Simply counting every submission would risk overstating the number of affected properties.
Subterra preserved the original submissions while creating a cleaner canonical layer for operational use.
The damage workflow received 832 raw submissions. Review and duplicate detection produced 741 canonical reports, with 91 duplicate rows identified across 77 groups.
This served several purposes:
- Original submissions remained available for review and accountability.
- Response teams received a more reliable count of affected properties.
- Duplicate reports did not artificially inflate damage totals.
- Updated information could be connected without erasing its history.
Geocoding was also kept outside the critical public submission path. A resident’s report did not have to wait for an external mapping service before being accepted. Addresses could be processed, cached, reviewed, and retried later without delaying intake.
Of the 741 canonical damage reports, 678 were successfully geocoded—approximately 91.5 percent.
A response that grew beyond one form
What began as damage reporting eventually became four principal public workflows: damage reporting, immediate housing needs, shelter and temporary-housing applications, and agricultural assessment. Across them, Subterra received 1,233 submitted form rows.
%%{init: {"flowchart": {"nodeSpacing": 32, "rankSpacing": 42, "curve": "basis"}, "themeVariables": {"fontSize": "20px"}}}%%
flowchart TB
    A["1,233 total submitted form rows"]
    A --> B["832 damage submissions"]
    A --> C["266 shelter applications"]
    A --> D["80 agricultural surveys"]
    A --> E["55 housing-needs responses"]

    classDef total fill:#7c3aed,stroke:#c4b5fd,color:#ffffff,stroke-width:2px;
    classDef damage fill:#b91c1c,stroke:#fca5a5,color:#ffffff,stroke-width:2px;
    classDef shelter fill:#1d4ed8,stroke:#93c5fd,color:#ffffff,stroke-width:2px;
    classDef agriculture fill:#047857,stroke:#6ee7b7,color:#ffffff,stroke-width:2px;
    classDef housing fill:#b45309,stroke:#fcd34d,color:#ffffff,stroke-width:2px;

    class A total;
    class B damage;
    class C shelter;
    class D agriculture;
    class E housing;

    linkStyle default stroke:#cbd5e1,stroke-width:2px;
These figures should not be interpreted as 1,233 unique people or households. Individuals could appear in more than one workflow, and original duplicate submissions were preserved. They do, however, demonstrate the volume of information received and processed during the response.
The canonical damage records also revealed the geographic and physical shape of the disaster. Most reports involved homes, many included measured water depth, and some residents reported several feet of water. Damage was especially concentrated around Plaucheville, Simmesport, Mansura, Cottonport, and Moreauville.
Those patterns mattered because they transformed hundreds of individual reports into a clearer operational picture of where damage was concentrated and which properties might require follow-up.
Iteration as an operational capability
The platform was designed to accept change.
Subterra released 11 production updates on launch afternoon. Additional capabilities followed across the weekend and the next week as the mission expanded from damage reporting into housing, shelter applications, volunteer coordination, and agricultural assessment.
Later, the platform would reach more than 100 successful deployments as additional needs, safeguards, and operational improvements were identified.
The feedback loop included residents, volunteer organizations, reviewers, the Police Jury, the 911 center, and GOHSEP. Because the application’s data foundation was separated from its forms and review workflows, the team could translate those requests into focused updates without destabilizing the entire system.
The result was not one rushed release. It was a series of small, controlled improvements made while the platform was already serving the public.
What made the response possible
Subterra’s speed did not come from having a finished emergency-management product ready before the flood. It came from several practical decisions:
- Launch the smallest version capable of supporting real work.
- Use managed infrastructure that could scale without provisioning servers.
- Keep structured records separate from large image files.
- Process photographs on the resident’s phone before uploading them.
- Allow essential reports to succeed even when photographs failed.
- Keep mapping and geocoding outside the critical submission path.
- Preserve original submissions while creating clean operational records.
- Give reviewers useful tools early instead of waiting for every feature.
- Release small improvements continuously.
- Keep direct communication open with the public and response partners.
- Continue working through the weekend as the mission expanded.
The technology mattered, but the feedback loop mattered just as much.
Residents explained what they were experiencing. Volunteer organizations showed where coordination was breaking down. Reviewers clarified what information they needed. The Police Jury defined local operational requirements. The 911 center and GOHSEP provided emergency-management context.
Subterra used those signals to keep improving the system.
The Result
When the rain began on Thursday morning, this platform did not exist. By Thursday afternoon, residents were already using it.
Over the days that followed, the system changed with the parish. It helped document damaged homes, organize information for local reviewers, capture the needs of displaced families, support the temporary-housing process, connect volunteers with residents asking for help, and give farmers a structured way to document an agricultural disaster.
By the end of the response, the platform had received more than 1,200 public submissions, retained more than 4,600 photographs attached to operational records, supported the review of 239 distinct shelter households representing 704 people, and documented $34.58 million in self-reported agricultural losses. Those figures matter because they show the scale the system eventually reached.
But the most important result is simpler: Avoyelles Parish had a new problem, then another, then another—and the system kept changing to meet them.
Subterra donated the platform, infrastructure, and the team’s time because this was our community, too. The project was never approached as a commercial engagement. It was an opportunity to use the skills and infrastructure we already had where they could be useful immediately.
What emerged was more than a disaster-reporting website. It became a living coordination system, built during an active emergency and continuously reshaped by residents, local officials, volunteers, reviewers, the 911 center, and state emergency-management partners.
In an emergency, speed matters. But speed by itself is not the lesson. The lesson is that useful technology can begin small, listen closely, preserve what matters, and evolve fast enough to remain relevant as the situation changes.